Beware of (terribly) misleading data in the news (and from other sources)!

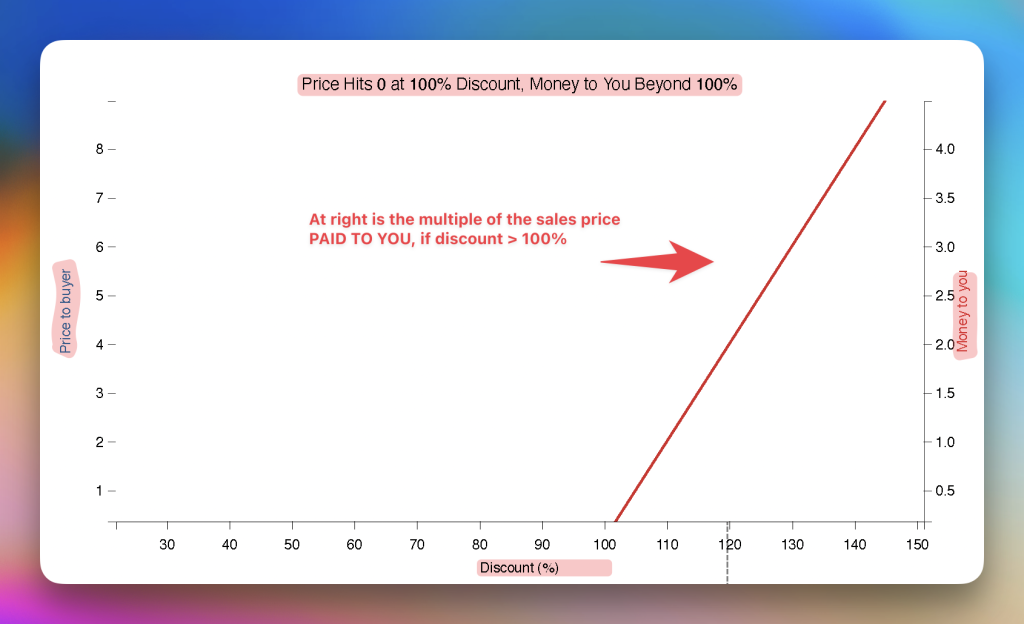
The Hidden Risks of Misleading Numbers in the News

Numbers give headlines weight, but when they’re presented poorly they can do more harm than good. From overstated percentages to cherry‑picked data, misleading statistics erode trust, fuel division, and push people toward bad decisions—whether it’s a health choice or a vote. Below are the most common ways the press gets its math wrong, concrete (hypothetical) examples, and a deeper dive into why each mistake matters.

This posting includes formulas that some might find complex, but the basic items listed should still offer some valuable insights.

Why it’s wrong (expanded):

Selective timeframe: The article shows only the first three months of 2024, a period when a temporary crackdown reduced petty offenses. During the same three‑month window in 2023, violent assaults actually rose by 15 %. By ignoring the previous year’s data, the story hides a crucial counter‑trend.


Misleading trend inference: Readers infer a sustained downward trajectory, yet the data set is too narrow to support that conclusion. Long‑term trends require multiple years of comparable data points; otherwise, short‑term fluctuations are mistaken for lasting change.


Policy implications: Decision‑makers might allocate resources based on an incomplete picture, reinforcing strategies that don’t address the underlying problem.

Why it’s wrong (expanded):

Baseline matters: The study started with a baseline risk of 0.6 % (six cases per 1,000 people). An 80 % relative reduction brings the risk down to 0.12 %—a difference of only 0.48 % in absolute terms. Most readers interpret “80 %” as a massive health breakthrough, overlooking that the absolute benefit is less than half a percent.


Sample size distortion: The trial involved 20 participants on the diet and 20 controls. Small samples inflate variability; a single additional event can swing the percentage dramatically. Larger, randomized trials often produce more modest relative reductions.


Decision bias: Physicians and patients may overvalue the diet, diverting attention from interventions with larger absolute benefits (e.g., blood‑pressure control, smoking cessation).

Why this headline is misleading (with the math explained):

  • Large margin of error
  • The poll reports that 60 percent of respondents support Candidate A. This is the observed proportion—the share of people in the poll who chose that candidate.
  • Because the poll surveys only 150 people, not every voter, the result is uncertain. We measure this uncertainty using the standard error, which estimates how much the result would vary if the poll were repeated many times with different random samples.
  • The standard error is calculated as:
    • Square root of (p × (1 − p) ÷ n)
    • Where:
    • p = observed proportion (0.60)
    • 1 − p = proportion not supporting Candidate A (0.40)
    • n = number of respondents (150)
  • Plugging in the numbers:
    • Square root of (0.6 × 0.4 ÷ 150)
    • = Square root of (0.24 ÷ 150)
    • = Square root of 0.0016
    • 0.04, or 4 percent
  • Calculating the 95 percent confidence interval
    • A confidence interval gives a range of values that likely contains the true level of support in the full voting population.
    • For a 95 percent confidence level, we multiply the standard error by 1.96:
    • 4 percent × 1.96 ≈ 8 percent
    • We then add and subtract this margin from the reported result:
    • Lower bound: 60 percent − 8 percent = 52 percent
    • Upper bound: 60 percent + 8 percent = 68 percent
  • Risk of sampling bias
    • All of these calculations assume the sample represents the broader electorate. If the poll relied on a convenience sample, such as online volunteers, certain groups may be over-represented while others are under-represented. In that case, even the confidence interval may be misleading. More reliable polls use methods like random-digit dialing or stratified sampling to better reflect the population being studied.
  • Over-interpretation of results
    • A single poll with a small sample size is only a noisy snapshot, not a forecast. Treating it as definitive can mislead readers and influence campaign donations, voter enthusiasm, and media coverage despite the substantial uncertainty.

Why it’s wrong (expanded):

Hidden confounder: Both ice‑cream consumption and beach attendance surge in summer months. More people in the water naturally increase the chance of shark encounters, while hotter weather drives higher ice‑cream sales. The common variable (season) explains the parallel rise.


Spurious correlation: Statistical correlation (r ≈ 0.7) does not imply a mechanistic link. Without controlling for the confounding factor, any causal claim is unfounded.


Public perception: Such sensationalist links can create irrational fears (e.g., avoiding ice‑cream) and distract from genuine preventive measures (e.g., beach safety protocols).

Why it’s wrong (expanded):

Prevalence Effect:
Suppose the community prevalence of COVID-19 is 1% (i.e., 10 out of every 1,000 people are infected). Even with a test that has 95% sensitivity and 98% specificity, the Negative Predictive Value (NPV) is about 99.5%. This means that if you test negative, there’s a 99.5% chance you do not have COVID-19.

The NPV can be calculated using the formula:NPV=True NegativesTrue Negatives+False Negatives\text{NPV} = \frac{\text{True Negatives}}{\text{True Negatives} + \text{False Negatives}}NPV=True Negatives+False NegativesTrue Negatives​

Where:

  • True Negatives (TN) are the individuals who are not infected and test negative.
  • False Negatives (FN) are the individuals who are infected but test negative.

In terms of sensitivity (Sens\text{Sens}Sens), specificity (Spec\text{Spec}Spec), and prevalence (Prev\text{Prev}Prev), the NPV formula becomes:NPV=(1Prev)×Spec(1Prev)×Spec+Prev×(1Sens)\text{NPV} = \frac{(1 – \text{Prev}) \times \text{Spec}}{(1 – \text{Prev}) \times \text{Spec} + \text{Prev} \times (1 – \text{Sens})}NPV=(1−Prev)×Spec+Prev×(1−Sens)(1−Prev)×Spec​

Let’s plug in the values for the test:

  • Prevalence (Prev – know or estimate) = 0.01 (1% of people are infected).
  • Sensitivity (Sens) = 0.95 (95% of actual cases are identified).
    • Formula for Sensitivity: Sensitivity=True Positives (TP)True Positives (TP)+False Negatives (FN)\text{Sensitivity} = \frac{\text{True Positives (TP)}}{\text{True Positives (TP)} + \text{False Negatives (FN)}}
      • True Positives (TP) are people who are infected and test positive.
      • False Negatives (FN) are people who are infected but test negative.
  • Specificity (Spec – must know beforehand) = 0.98 (98% of non-cases are correctly identified).

Now, calculate the NPV:NPV=(10.01)×0.98(10.01)×0.98+0.01×(10.95)\text{NPV} = \frac{(1 – 0.01) \times 0.98}{(1 – 0.01) \times 0.98 + 0.01 \times (1 – 0.95)}NPV=(1−0.01)×0.98+0.01×(1−0.95)(1−0.01)×0.98​ NPV=0.99×0.980.99×0.98+0.01×0.05\text{NPV} = \frac{0.99 \times 0.98}{0.99 \times 0.98 + 0.01 \times 0.05}NPV=0.99×0.98+0.01×0.050.99×0.98​ NPV=0.97020.9702+0.0005=0.97020.97070.9995\text{NPV} = \frac{0.9702}{0.9702 + 0.0005} = \frac{0.9702}{0.9707} \approx 0.9995NPV=0.9702+0.00050.9702​=0.97070.9702​≈0.9995

So, the NPV is approximately 99.95%, meaning that if you test negative, there’s a 99.95% chance that you do not have COVID-19. However, this does not guarantee that all negative results are accurate.

Even in a low-prevalence setting (1%), there are still about 5 false negatives out of every 1,000 negative results, which means some infected individuals will be missed by the test.


False Reassurance:
While the NPV of 99.95% sounds high, the absolute number of missed cases is still significant in a low-prevalence setting. For instance, with a 1% prevalence (10 infected individuals per 1,000), about 5 out of 1,000 people who test negative are actually infected. As a result, people who test negative may mistakenly assume they are completely safe and abandon important protective behaviors, like masking or distancing. This false reassurance can unintentionally increase the risk of transmission.


Clinical Decision-Making:
For accurate interpretation of test results, physicians need to consider sensitivity, specificity, and the prevalence of the disease in the population (do they even understand these concepts?).

The NPV is highly dependent on prevalence, and headlines that ignore base rates (e.g., “Test catches 95% of cases”) can give a skewed sense of certainty about a negative test result. Without understanding the base rate, the public and even medical professionals may misinterpret the test results, potentially leading to incorrect clinical decisions.


Key Takeaways:

  1. NPV is influenced by Prevalence: Even with a high NPV (99.5%), the absolute number of false negatives can still be significant when disease prevalence is low.
  2. Formula Context: The NPV formula helps illustrate how specificity, sensitivity, and prevalence interact in real-world scenarios, influencing test reliability.
  3. Real-World Impact: The false reassurance from a negative result can lead to risky behavior, especially in low-prevalence areas, where the test still misses a small percentage of actual cases.

Why it’s wrong (expanded):

Skewed distribution: Teacher salaries are heavily right‑skewed because a small number of administrators, department heads, or teachers in affluent districts earn substantially more. Those outliers raise the arithmetic mean.


Median as a better indicator: The median salary—where half earn more and half earn less—is approximately $45,000, reflecting the typical teacher’s earnings. Using the mean masks the financial reality for the majority.


Policy consequences: Legislators may underestimate the need for salary reforms if they rely on the inflated average, perpetuating inequities in education funding.

Why it’s wrong (expanded):

Visual exaggeration: A 0.5 % increase (from 4.0 % to 4.5 %) appears as a towering bar when the axis is truncated, implying a dramatic economic downturn. In reality, the change is modest and within normal monthly fluctuation.


Perception bias: Human brains interpret length proportionally; a compressed baseline inflates perceived differences. This can provoke unnecessary panic or political pressure.


Best practice: Graphs should start at zero (or clearly label any deviation) to preserve proportional integrity and allow readers to gauge true magnitude.

There have also been graphs with two lines where each line came from a different set of axes (on separate graphs, combined in one graph to confuse). The effect was to misstate what was actually happening for political motives. When the two-line graph used the same axes for both lines (as you would need to actually do!), the misleading conclusions from the original graph were nowhere in sight.

Why it’s wrong (expanded):

First of all, including information like this, including a “p-value” can only confuse people (the desired result?) who do not have statistical and hypothesis testing experience.

Arbitrary threshold: The conventional cutoff for “statistical significance” is p < 0.05. A p‑value of 0.06 indicates a 6 % probability that the observed effect is due to random chance—still relatively high.

Risk of Type I error: Declaring a finding “significant” when it doesn’t meet the threshold increases the likelihood of false positives, leading to premature adoption of ineffective or unsafe treatments. Type I error: Rejecting a true null hypothesis.

The p-value is similar but it’s the probability of observing data at least as extreme as what we observed, assuming the null hypothesis is true. When the p-value is less than 0.05, we typically reject the null hypothesis.

Context matters: Researchers sometimes report “trend‑level” findings, but headlines that ignore the nuance mislead the public and clinicians alike.

Why These Mistakes Matter

Each slip can sway public opinion, affect voting patterns, and alter health behaviors. When people act on distorted data—whether backing a flawed policy, skipping a beneficial treatment, or spreading unnecessary fear—the whole society suffers. Repeated exposure to shaky stats also breeds cynicism, making audiences dismiss even solid reporting.

Building Better Media Literacy

To protect yourself from these pitfalls, try the following:

Seek the original source – Locate the study, dataset, or official report behind the claim.
Demand context – Look for absolute numbers, sample sizes, confidence intervals, and the time frame covered.


Read graphs critically – Verify axis origins, scaling, and whether data points are aggregated or disaggregated.


Question causality – Ask whether a plausible third variable could explain a correlation.
Compare averages – When possible, ask for median or percentile figures to gauge distribution shape.

Check statistical thresholds – Understand what p‑values, confidence levels, and margins of error actually signify.


Conclusion

Good journalism relies on the integrity of data, yet far too often, statistics and graphs are intentionally distorted to push a particular agenda. Numbers are selectively cherry-picked, axes are manipulated, and trends are exaggerated—deliberate tactics designed to mislead and sway public opinion. This isn’t just careless reporting; it’s a calculated strategy to manipulate perception and control decision-making. In a world where data is weaponized to distort reality, the public’s trust in numbers is systematically eroded, and with it, our ability to make informed, rational decisions.

To combat these issues, we must demand better—not only from the media but from ourselves. Critical thinking isn’t just a passive response; it’s an active, ongoing defense against those who weaponize statistics for manipulation. Skepticism, when applied to data, is not an attack on the truth—it’s a safeguard against the misuse of information. The media must be held accountable, not only for the facts they report but for how they present them. Sadly, many outlets lack a deep understanding of the data they disseminate, blindly passing along numbers that are often misleading or incomplete. This makes us, the consumers, responsible for being the final check on the truth.

We must not only question the numbers we see but also demand transparency in how those numbers were gathered and analyzed. When statistics are presented to us, we must ask: Who benefits from this narrative? What’s being left out? How were the data collected? These are the critical questions that will reveal when statistics are being used to manipulate, rather than inform.

Let’s try to raise the bar for accuracy and transparency and take back control from those who distort data for power or profit. Then can we use statistics as they were meant to be used: not as a tool for manipulation, but as a means of clarity, understanding, and making decisions grounded in truth.

Please read our disclaimer on our home page.

1 / 0 = 0? Who are these teachers?

We heard recently about a third-grade teacher teaching her student that “1 divided by zero is zero”. What??!!!

What makes matters even worse is that, according to the report, the principal agreed with the teacher when confronted! So, apparently, both the teacher and principal lacked third-grade math knowledge (see fictitious image above).

This solution is totally nonsensical. Do we honestly have teachers teaching our kids this incorrect math?

Furthermore, when confronted with solid (basic math, in this case) evidence to the contrary it’s not clear if they modified their “belief”. So much for the scientific method, let alone third-grade math not understood by adults in the US educational system (including math teachers and principals, apparently).

While we certainly agree that in the “limit” as x->0, (1/x) would approach infinity. But “at” zero, 1/0 is still undefined. Learning about limits isn’t typically taught in the third-grade, yet, however.

The basic division test: As you would do with a result like 15/5 = 3 where you can multiply the result by the denominator to get the numerator (in this case 3 * 5 = 15), with 1/0 what number do you multiply the denominator by to get 1? In other words what number, times zero is 1? Answer: there isn’t one!

Here’s an intertaining YouTube video:

This video, while very well done, it’s depressing that someone actually had to make it.

Consider other videos where people are asked on the street what is 2 x 2 x 2 and cannot answer correctly. Or when asked “what is 15/3”. Nope, lots got that wrong also. When asked what time it is at a quarter after 6, many answer 6:25. “How many dimes in a dollar?” ….

With an estimated 40% of students unable to read by some reports, having a teacher who is teaching math but does not know basic math that he or she is teaching is a flashing red light — yet another one — that our educational system in the US is beyond broken.

In other news … what about the college student at the University of Connecticut that graduated from High School but can neither read nor write? This student was not “functionally” illiterate, but actually illiterate.

In Summary:

1/0 is undefined.

0/1 is zero.

Food for thought

0/0 is another special case (also not zero or 1). Zero divided by zero is undefined in standard arithmetic. This one is easy to prove also.

Please read our disclaimer on our home page…

Why a 500% Discount Is Simply Wrong (Mathematically Impossible)

When politicians or advertisers claim something is offered at a “500% discount,” it’s mathematically impossible (NOT POSSIBLE!). A discount reduces the price, from the original price. A discount more than 100% doesn’t make sense.


Understanding Percentages (review):

A percentage is a part of 100. A 100% discount means you get the full value of an item for free. If something costs $100, a 100% discount brings the price to $0. A 20% discount on that same $100 item brings the price to $80.

So, what Does 500% Mean?

A 500% discount means the discount is five times the original price. If an item costs $100, a 500% discount would mean you’re paid $400 to take the item. This situation is impossible—prices can’t go below zero, and no one is going to pay you to buy something.

Politicians or advertisers often use exaggerated claims to make what they’re saying “sound” more appealing. They often make the same bogus mathematical claims over and over to try to legitimize what they’re saying (or, sadly, they actually believe what they’re saying is true).

But a “500% discount” is not only misleading but simply wrong. Such a stated discount grabs attention, but the claim doesn’t hold up with even 6th grade math. If the discount were actually 500%, we would get a discount percentage larger than 1 — see Example 2 below.

A discount percentage larger than 100% (1) is economically meaningless as a pure discount, because it would require the seller to pay the buyer.

Let’s look at a couple examples to better understand.

Example 1 below is a normal situation we encounter.

Example 2 below would never happen, but is the exact situation politicians and others say with a straight face over and over is what “would” happen.


Example 1: A Simple Discount Calculation (Normal Situation)

Let’s say a car that normally costs $30,000 is at a 15% discount. What do we actually end up paying in this case?

Step 1: Convert the percentage: 15% = 0.15. (15/100 = 0.15)

Step 2: Calculate the discount: 0.15 × $30,000 = $4,500. ($4,500 is the discounted amount “off” the price)

Step 3: Calculate the final price (full price minus discount): $30,000 – $4,500 = $25,500.


Example 2: What Would a 500% Discount Look Like? (Fictional and Absurd — You make money!)

Let’s imagine, just for fun, that a car is offered at a 500% discount. Hurray! This “discount” matches the absurd political language you actually hear on TV over and over.

Below we use the same three steps as in the above example.

Step 1: Convert 500% to a number we can use to multiply. As above divide the percent by 100. So, 500% = 500/100 = 5. (Wow, this discount is greater than 1!)

Step 2: Calculate the discount: 5 × $30,000 = $150,000. Notice that the discount is now five times the sales price!

Step 3: Calculate the final price: $30,000 – $150,000 = – $120,000.

So, $120,000 means the dealer would pay you $120,000 to take the car, which is clearly impossible and would never happen.

The first 100% is the total cost of the car, or $30,000. The next 400% is four times the sales price or 4 * 30,000 = $120,000. So, in this case, $120,000 is what the dealer would PAY YOU!


Graphs:

To help clarify, the two graphs below demonstrate each case from the two examples above.

Graph: Impact of Discount Percentage on Price.

The graph below shows that as the price drops by 100%, the cost is zero and cannot go further. Simple … 6th grade math.

Graph below showing MONEY TO YOU when discount > 100%.

Sidebar: When Do Students Learn About Percentages?

Students usually start learning about percentages in grades 4 or 5 (ages 9-11). By middle school (grades 6-8), they should be able to calculate percentages and apply them to real-world situations like discounts.

By high school, students understand that a 100% discount means an item is free, and any discount above 100% is impossible, as it would imply a negative price.

Unfortunately, many students are not getting the math skills they need. Studies show over half of U.S. adults (57%) read at or below an 8th-grade level, and critical thinking in education is often overlooked and undervalued. This educational erosion (some say collapse) makes it harder to for citizens to do basic math, basic reasoning, or critical thinking.

https://nces.ed.gov/surveys/piaac

Conclusion:

A “500% discount” (or any discount > 100%) is mathematically impossible. Any “discount” greater than 100% would be money paid to you! Anyone who claims a discount > 100% is possible either does not understand middleschool math or is lying to you.

It could be argued that such spouted mathematical incompetence is either intentional and meant to distract from other issues or to say rather than having an actual plan for what’s being discussed.

Don’t be fooled!

Please read our disclaimer on our home page…

Little Snitch: The Essential Firewall for Your Mac

With digital privacy increasingly under threat, securing your online presence has never been more crucial. Little Snitch, a popular firewall for Mac, is a powerful tool to protect your data and monitor outgoing network traffic. Whether you’re browsing the web, using apps, or transferring files, Little Snitch gives you full control over what leaves your computer and where it goes.

How Little Snitch Works

Unlike traditional firewalls that primarily block incoming connections, Little Snitch controls outgoing traffic. Whenever an app tries to send data over the internet, Little Snitch alerts you with a notification. You can then decide whether to allow or block the connection. This flexibility gives you granular control over how your apps interact with the internet, ensuring that no unauthorized data leaks occur.

For example, you could set a rule for the Brave browser that blocks any connections to Facebook or to, say, Google advertising.

Moreover, you might not want a third-party app to send personal information or usage data back to its developer without your consent. Little Snitch lets you block that app from establishing an outbound connection, giving you peace of mind. This detailed configuration control helps ensure that only the applications you trust can communicate online.

Key Benefits of Little Snitch

  1. Enhanced Privacy
    Little Snitch shields your sensitive data from being sent to unknown or untrusted servers. Apps often collect and transmit user data for various reasons—some legitimate, others not so much. Little Snitch helps you identify and prevent these unwanted data transmissions, safeguarding your privacy.
  2. Real-Time Traffic Monitoring
    The app has a detailed overview of your network activity in real-time. You can see which apps are connecting to which servers, giving you a clear picture of what’s happening behind the scenes. This transparency helps you make informed decisions about which apps should be allowed internet access.
  3. Customizable Rules
    Little Snitch allows you to create custom rules for each app, so you can choose exactly which connections are permitted and which aren’t. These rules can be set globally or applied to specific network locations, giving you the flexibility to adapt your firewall to your changing needs.
  4. Automatic Alerts
    With Little Snitch’s automatic notifications, you’ll always be in the loop about which apps are making network connections. You can allow or block these connections instantly with just a click. It’s a simple yet powerful way to maintain control over your Mac’s security. If some part of an app is not working as expected after you block some connection, you can modify the Little Snitch rule for that connection as needed.
  5. Profiles
    You can also create separate connection profiles. For example, perhaps you might need a set of rules for “work” and another set of rules for “home”. You can also set up a profile to stop all Internet access when you are not using your machine.

Suspected Data Stealing Connections

Attempted outgoing connections to Google, FaceBook, and LinkedIn are all suspects for possible data stealing. Note that some application programs, for example, use Google “APIs” which an app may need to function.

Note that with many application programs, you can get many, many pop-ups for attempted outgoing connections. So, when adding a new application, especially any popular commercial application, plan to spend some time with Little Snitch to fine tune the permissions. You may need to look up some of the connection attempts online to get more information. Little snitch itself gives you some information, but it’s not always enough.

Checking and Updating Rules

While Little Snitch is incredibly effective at protecting your privacy, it’s essential to check and update your rules from time to time. Over time, your needs and the apps you use may change, and outdated or overly restrictive rules could interfere with your normal workflow. Regularly reviewing and adjusting these rules ensures that your firewall works optimally without blocking legitimate traffic. Sometimes, you might have been busy and just clicked “Allow any connection.”. Thus, by reviewing your Little Snitch rules from time to time, you can go back, review, and then further restrict, if needed, application outgoing data access.

For example, some apps may require certain network connections for updates or new features to function properly. If you’ve blocked these connections previously, you might encounter problems with the app’s performance. By revisiting your firewall rules, you can adjust permissions and avoid unnecessary disruptions.

Additionally, as new apps and system updates are installed, it’s important to verify the rules for these new connections. Not all apps are transparent about their network activity, so reviewing their outbound connections regularly helps you spot any unexpected or suspicious behavior.

Conclusion

With companies increasingly trying to monetize YOUR data (read: spying on you and your computer activities), Little Snitch is a must-have tool for Mac users who value privacy and want to maintain control over their online activity. Its intuitive design, powerful monitoring capabilities, and customizable rules make it one of the best firewalls available for macOS. However, to ensure ongoing protection, it’s crucial to periodically check and adjust your firewall rules. With Little Snitch, you’re not just blocking threats—you’re actively managing your digital security.

Please read our disclaimer on our home page…

GrapheneOS: A Strong Alternative to Google and Apple Phones

In today’s digital world, privacy is a growing concern for many smartphone users. Both Google and Apple, while offering impressive features and ecosystem integration, have been scrutinized for their data collection practices. GrapheneOS is a compelling alternative for those who prioritize privacy without compromising essential smartphone functionality.

Enhanced Privacy and Security

GrapheneOS is an open-source, privacy-focused mobile operating system based on the Android Open Source Project (AOSP). Unlike stock Android or iOS, it is designed with security and privacy at its core. GrapheneOS has various security enhancements that protect against both known and unknown threats. The OS does not rely on Google Play Services, which are known for tracking user data. By eliminating these services, GrapheneOS minimizes data shared with external entities, offering a more private user experience. Note: you can still use Google Play Services in with sand-boxed privacy.

Independence from Google and Apple Ecosystems

Google and Apple dominate the smartphone market with ecosystems that integrate cloud services, apps, and devices. This integration often reduces user privacy. Both companies collect much data to enhance user experience and, sadly, targeted advertising. In contrast, GrapheneOS operates independently of these ecosystems. Users thus have the freedom to decide what apps and services to install, giving them control over their data.

GrapheneOS also has many privacy-respecting applications and services, enabling users to maintain functionality without sacrificing privacy. For instance, users can install apps through F-Droid, a repository of open-source apps that respect user privacy, or use alternative app stores that do not track behavior.

Customization and User Control

GrapheneOS offers extensive customization. Users can tailor their devices to meet specific privacy and security needs, including fine-tuned control over permissions, application sandboxing, and network access. Unlike stock Android or iOS, which often limit user control, GrapheneOS gives users the power to lock down their devices as tightly as desired.

Additionally, GrapheneOS has regular updates that improve security and privacy. These updates are delivered without the bloatware and potential vulnerabilities that often accompany updates from Google or Apple.

Avoiding the Data Economy

When data is often referred to as the new oil, avoiding excessive data collection is increasingly challenging. Google’s business model heavily relies on advertising revenue driven by user data. Apple, while touting its privacy initiatives, still collects data to improve services and experiences. Apple’s data collection is more prevalent in iOS.

GrapheneOS is an alternative in this data economy. By stripping constant data collection and sharing, GrapheneOS allows users to disengage from the pervasive data-driven business models of major tech companies. This disengagement means fewer concerns about how personal data is used, stored, or shared, with more peace of mind for privacy-conscious users.

A Viable, User-Centric Option

For those who prioritize privacy over ecosystem integration, GrapheneOS is a viable, user-centric option. Its focus on privacy, security, and user control makes it an appealing choice in the digital age. While it may not yet offer the same level of ecosystem integration as mainstream counterparts, the trade-off for privacy and autonomy is one that many users may find worthwhile.

Check out many of the YouTube videos and especially the GrapheneOS website itself.

Please read our disclaimer on our home page…

Why Faceless Companies Never Pay for Data Breaches and What Can Be Done

Data breaches are a growing issue in the digital age, exposing sensitive personal information like credit card details, medical records, and social security numbers. Despite the significant risks these breaches pose to consumers, many companies fail to face meaningful consequences for their role in these incidents. This article explores why companies often avoid paying for data breaches and provides practical steps both businesses and individuals can take to mitigate these risks.

Why Companies Avoid Paying for Data Breaches (especially in the US)

Weak Legal and Regulatory Frameworks

One of the main reasons companies avoid significant penalties after data breaches is the inadequacy of current legal frameworks. While laws like the General Data Protection Regulation (GDPR) in Europe and the California Consumer Privacy Act (CCPA) in the United States are steps in the right direction, penalties are often insufficient when compared to a company’s total earnings. For instance, under GDPR, companies can be fined up to €20 million or 4% of annual turnover, but these fines are rarely substantial enough to act as a true deterrent for large corporations. Even when penalties are imposed, they often fail to impact the company’s bottom line in a meaningful way.

Externalized Costs

Another reason businesses avoid the consequences of data breaches is that many of the costs are externalized. The financial burden of a breach often falls on consumers, who may experience identity theft or fraud, while companies may rely on cyber liability insurance to cover immediate costs. This allows companies to minimize their financial exposure, while consumers deal with the long-term effects, such as the time and effort needed to resolve identity theft or credit issues. This externalization of costs weakens the incentive for companies to invest in stronger cybersecurity measures.

Risk Management via Insurance

Many companies also treat data breaches as an inevitable risk and factor potential breach costs into their overall risk management strategy. Instead of investing heavily in cybersecurity, businesses often purchase insurance policies that cover breach-related expenses. This approach allows companies to continue operating with minimal disruption and without facing significant financial consequences, which reduces the incentive to invest in more robust cybersecurity infrastructure.

What Can Be Done?

Strengthening Regulations and Penalties

Governments need to strengthen data protection laws and impose more substantial penalties on companies for failing to protect consumer data. For instance, penalties should be scaled based on the severity of the breach and the size of the company, ensuring that large corporations with greater resources face significant fines. Additionally, businesses should be required to compensate affected consumers for the direct financial losses caused by breaches, including fraud and identity theft, to hold companies fully accountable.

Increasing Corporate Accountability

Companies need to prioritize cybersecurity at the executive level. Appointing a Chief Information Security Officer (CISO) who reports directly to the CEO and board would ensure that data protection is embedded in the company’s overall business strategy. Regular audits, increased employee training, and the implementation of best-in-class cybersecurity measures should become standard practices. Businesses should also adopt a proactive approach to security, such as conducting regular penetration testing and updating their systems to defend against new threats.

Actions for Consumers

While businesses hold primary responsibility, consumers can also take steps to protect themselves from the consequences of data breaches:

  1. Use Secure Communication Tools: When sending sensitive information, avoid unencrypted email and text messages. Instead, use secure alternatives such as ProtonMail for email or Signal for text messaging. These platforms use end-to-end encryption, ensuring that only the intended recipient can read the message, making it far more secure than traditional email or SMS.
  2. Enable Two-Factor Authentication (2FA): Whenever possible, enable 2FA on your accounts. This extra layer of security makes it more difficult for hackers to access your accounts, even if they manage to steal your password. Favor hardware keys or Passkeys and never use the least secure SMS for 2FA.
  3. Monitor Financial Accounts and Credit: Regularly check your bank and credit card statements, as well as your credit report, to catch unauthorized transactions or signs of identity theft early.
  4. Use Strong, Unique Passwords: Utilize a password manager to generate and store complex, unique passwords for each account. Avoid reusing passwords across different platforms.
  5. Be Cautious of Phishing Scams: Always be suspicious of unsolicited emails or messages, especially those that ask you to click on links or provide personal information. These are common tactics used by hackers to steal sensitive data.
  6. Use Encryption Tools: For particularly sensitive communications, use encryption tools like VeraCrypt for file encryption or Cryptomator for cloud storage encryption. These tools can help protect your personal data from unauthorized access.
  7. Let these companies know it’s NOT OK for them to have your information hacked (in plain, unencrypted data) from their lacking IT practices, social engineering, or whatever the weak links they have are. Demand that they use encryption on their servers to safeguard your information so, if compromised, your data is gibberish to the attackers.
  8. Contact your Congressional Representatives to demand they introduce legislation to severally punish companies who have sensitive consumer data hacked, leaked, or similar.

Conclusion

While companies often escape the true financial consequences of data breaches, there are steps both businesses and individuals can take to reduce the risks and improve security. Strengthening legal penalties, ensuring greater corporate accountability, and promoting a culture of cybersecurity within businesses are key measures to address this issue. Consumers can also take practical steps, such as using secure communication tools like ProtonMail and Signal, enabling 2FA, and practicing vigilance in monitoring their personal information. By taking these actions, individuals and businesses alike can better protect sensitive data and minimize the impact of data breaches in an increasingly connected world.

Please read our disclaimer on our home page…

Do you skimp on privacy protections because you feel you have … “nothing to hide”?

The “I’ve got nothing to hide” argument often arises in discussions about privacy, surveillance, or data collection. People using this argument might suggest that, because they believe they are not doing anything wrong, they have no reason to worry about privacy intrusions.

Here, of course, we’re talking about emails, texts, and related data you use, share, or create on a computer. Now, when you have a conversation with someone in person, that conversation is automatically private. You never have to think about privacy. However, now that everything you do on a computer is stored on servers, potentially forever, privacy is something that is no longer guaranteed and seems to be quickly eroding from daily life.

1. Privacy is a Fundamental Right:

• Privacy is a human right that supports individual autonomy, freedom of expression, and democracy. Even if someone feels they have nothing to hide, upholding privacy is about maintaining the principle that individuals have the right to control their personal information.

2. Misuse of Data:

• Data collected can be misused in ways that individuals cannot foresee. For example, information could be taken out of context, used to manipulate or discriminate against individuals, or could be leaked or stolen by bad actors.

3. Chilling Effect:

Knowing that one’s actions are being monitored can lead to self-censorship, where people might avoid expressing certain opinions, exploring certain ideas, or engaging in legal activities simply because they fear being watched. This “chilling effect” can stifle free speech and creativity.

4. Evolving Norms and Laws:

What is considered acceptable or legal today might not be the same tomorrow. Information that seems harmless now could be used against someone in the future if societal norms or laws change.

5. Collective Impact:

The argument focuses on individual privacy but ignores the collective impact of mass surveillance. When large groups of people give up their privacy, it can normalize invasive practices and erode protections for everyone, making it easier for governments or corporations to impose even more intrusive measures.

6. Security through Obscurity:

• Privacy can act as a layer of security. Even if someone feels they have nothing to hide, keeping information private can protect them from identity theft, targeted advertising, or other forms of exploitation.

7. Selective Privacy:

• People naturally maintain privacy in various aspects of their lives, such as with passwords, personal conversations, or medical information. This evidence shows that everyone values privacy in some contexts, even if they claim to have “nothing to hide.”

8. Future Consequences:

What someone does today might seem innocuous, but the consequences of having that information accessible to others could be significant in the future, especially if their circumstances or the broader political environment changes.

These points help illustrate that privacy goes beyond individual concerns and touches on broader societal, ethical, and practical implications.

Stay tuned for a future posting with suggestions for taking back your privacy…

Please read our disclaimer on our home page…

Spotting Red Flags: Warning Signs in Technical Job Advertisements

This image has an empty alt attribute; its file name is frustrated-programmer.webp

Finding the right job can be challenging, and job ads are often the first step in the process. However, not all job postings are created equal (to say the least!). It’s crucial to read between the lines to avoid potential issues. This guide explores common warning signs in technical job advertisements and offers strategies for navigating them effectively.

  1. Vague Job Descriptions

A vague job description can be a red flag. If the responsibilities and requirements lack clarity, it suggests that the company hasn’t fully defined the role or its needs. Look for specific details about the role, including the technologies, tools, and projects involved.

For instance, a job ad might state, “Looking for a skilled software developer to join our team.” This description lacks specificity and doesn’t give any insights into the responsibilities or required skills. In contrast, a more detailed job description might read, “Seeking a software developer with expertise in Python and experience with web development frameworks such as Django or Flask. Responsibilities include developing scalable web applications and collaborating with cross-functional teams.”

  1. Unrealistic Expectations

Beware of job ads that promise too much. If a job offers high salaries and rapid career advancement without clear expectations, it could be a red flag. Unrealistic expectations may indicate a company that is out of touch with market norms or one that is trying to attract candidates with false promises.

For example, a job ad might claim, “Entry-level position with a six-figure salary and opportunity for promotion within six months.” While competitive compensation and career advancement are desirable, such promises without proper context or criteria may signal an unrealistic or misleading offer.

  1. Lack of Company Information

Reputable companies usually inform you about their history, mission, culture, and values. A lack of company information may suggest a lack of transparency or a failure to prioritize employee engagement. Research the company independently to ensure it aligns with your values and career goals.

An ideal job advertisement would include details about the company’s background, such as its founding year, core values, notable achievements, and company culture. This information helps candidates gauge whether they would be a good fit for the organization and demonstrates the company’s commitment to transparency and openness.

  1. Poorly Written Ads

Pay attention to the language and tone of the job advertisement. Spelling and grammatical errors, formal language, and vague statements can indicate a lack of attention to detail or poor communication skills within the company. Well-written ads reflect positively on the company’s professionalism and culture.

For instance, a job ad riddled with spelling mistakes, needless company boilerplate, and grammatical errors may raise doubts about the company’s standards and attention to detail. Conversely, a clear, concise, and error-free ad conveys professionalism and fosters trust with potential candidates.

  1. Excessive Requirements

Some job ads list an overwhelming number of requirements. While it’s essential for employers to identify their needs, excessively long lists of requirements may indicate unrealistic expectations or the company’s non understanding of the role’s requirements. Look for ads that prioritize essential skills and experience.

An example of excessive requirements might include a job ad for a junior developer position that demands proficiency in ten different programming languages, five years of experience, and multiple certifications. Such requirements may deter qualified candidates and suggest a lack of clarity or flexibility in the hiring process.

  1. Lack of Diversity and Inclusion

Diversity and inclusion are crucial for a healthy work environment. A job advertisement that lacks diversity in its language or fails to mention diversity and inclusion initiatives may suggest that the company does not prioritize these values. Look for companies that actively promote diversity and inclusion.

A job ad that emphasizes diversity and inclusion initiatives, such as employee resource groups, mentorship programs, and diversity training, demonstrates a commitment to creating an inclusive workplace where employees feel valued and respected. Candidates from diverse backgrounds are more likely to feel welcomed and supported in such environments.

  1. Pressure Tactics

Beware of job advertisements that use pressure tactics to entice candidates. Urgent deadlines or exaggerated claims about the competition may indicate a company that is trying to rush candidates into making hasty decisions. Take your time to evaluate the opportunity carefully.

For example, a job ad might state, “Limited positions available. Apply now to secure your spot!” Such tactics create a sense of urgency and may pressure candidates into applying hastily without thoroughly assessing the opportunity. A reputable company will provide candidates with adequate time to consider their options and make an informed decision.

  1. Lack of Feedback or Communication

Pay attention to the company’s responsiveness and communication throughout the hiring process. Delays or a lack of feedback after interviews may indicate poor communication practices within the company. Clear and timely communication is essential for a positive candidate experience.

An ideal hiring process includes regular updates and feedback from the company to keep candidates informed and engaged. For instance, a company that promptly acknowledges receipt of applications, provides updates on the hiring timeline, and offers constructive feedback after interviews demonstrates respect for candidates’ time and effort.

  1. Watch for Keywords

Watch out for keywords in job advertisements that may indicate a potentially problematic work environment. Phrases like “rockstar,” “ninja,” “self-starter,” or “work hard, play hard” may suggest a company culture that prioritizes long hours, competition, and burnout. While some candidates may thrive in such environments, others may find them stressful or unsustainable.

10. The Headhunter Is Not Your Friend

Don’t believe for a second that the friendly headhunter you’re working with will (probably) do anything to advance your cause with the hiring company, that’s your job. The headhunter wants to make the “sale” (you or someone else) so he or she looks good and makes money. (They’re not called headhunters for no reason.) There is nothing wrong with the headhunter’s goals as long as you take them into account.


In conclusion, by remaining vigilant and attentive to the warning signs in technical job advertisements, you can avoid potential pitfalls and find opportunities that align with your skills and career goals. Thoroughly researching the company and trusting your instincts are essential steps in the process. With careful consideration, you can navigate the job market successfully and hopefully find the right fit for your career goals.

Is AI Going to Take Over Tech Programming Jobs?

As technology keeps getting smarter, a big question on everyone’s mind is whether artificial intelligence (AI) will start doing the job of tech programmers. Let’s take a closer look at this and what current software developers can do to stay on top of things.

Will AI Replace Tech Programmers?

While AI has come a long way, it’s unlikely to completely kick human programmers to the curb in the next five years. Programming isn’t just about writing lines of code; it’s about problem-solving, creativity, and understanding complex stuff. Sure, AI can help with some tasks like writing code and spotting bugs, but it’s not quite ready to take over the whole show.

What Should Software Developers Do to Get Ready?

  1. Make Friends with AI: Instead of worrying about AI stealing their thunder, software developers can see it as a buddy that helps them work better. Learning how to use AI tools can speed things up and free up time for more interesting tasks.
  2. Brush Up on People Skills: Tech skills are important, but so are people skills like teamwork and communication. These are things AI can’t do, so they’re worth polishing up on.
  3. Keep Up with the Times: The tech world moves fast, with new stuff popping up all the time. Software developers should stay in the loop with what’s hot and keep learning to stay sharp.
  4. Find Your Niche: While AI can do a lot, there will always be a need for experts in certain areas. By specializing in something you’re passionate about, you’ll stay valuable.
  5. Keep Learning: The best way to stay ahead of the game is to keep learning. Whether it’s taking a course or picking up a new skill, staying curious will pay off in the long run.

In a Nutshell

AI might be getting smarter, but it’s not about to push tech programmers out of a job just yet. By teaming up with AI, sharpening people skills, staying up-to-date, finding a niche, and never stopping learning, software developers can keep on thriving in the ever-changing world of tech. For the time being, I tend to think of AI as a friend that can help you get your job done better and faster.

This image has an empty alt attribute; its file name is image-8.png

This article aims to advise software developers navigating AI and programming. While the future is uncertain, staying adaptable and open to learning will always be key.

Unlocking Two-Factor Authentication (2FA): A Simple Guide

In online security, protecting your digital identity is crucial. Two-Factor Authentication (2FA) is a powerful tool for keeping your accounts safe from unauthorized access. This posting breaks down 2FA, looking at its methods, benefits, and potential drawbacks.

Understanding Two-Factor Authentication

This image has an empty alt attribute; its file name is user-2fa.png

2FA adds an extra layer of security to the traditional username-password setup. Instead of just using a password, 2FA requires another way to confirm your identity, like using your phone or a fingerprint. By requiring two different methods to log in, 2FA makes it harder for hackers to get into your accounts, even if they know your password.

Exploring 2FA Methods

  1. SMS Authentication:
    • Pros: Easy to use, as it sends a code to your phone.
    • Cons: Vulnerable to attacks where someone else takes control of your phone number.
  2. Time-Based One-Time Passwords (TOTP):
    • Pros: Adds an extra layer of security by generating a unique code that changes over time.
    • Cons: Relies on having a device with the right software to generate the codes.
  3. Push Notifications:
    • Pros: Convenient, as it sends a notification to your device for approval.
    • Cons: Prone to phishing attacks, where someone tricks you into approving access.
  4. Biometric Authentication:
    • Pros: Convenient and secure, using things like your fingerprint or face to confirm your identity.
    • Cons: Can be risky if someone steals or copies your biometric data.
  5. Hardware Tokens:
    • Pros: Provides offline authentication, reducing the need for an internet connection.
    • Cons: Can be expensive and challenging to manage.

Choosing the Right 2FA Method

The best method for you depends on your preferences and security needs. While SMS authentication is straightforward, more security-conscious users might prefer methods like TOTP or biometric authentication.

Best Practices for Implementing 2FA

  • Educate yourself and others about the importance of 2FA.
  • Use 2FA on all your accounts whenever possible.
  • Keep your 2FA settings up to date and review them regularly.
  • Be cautious of phishing attempts and always verify requests for authentication.

In Conclusion

Two-Factor Authentication is essential for helping you protect your online accounts from unauthorized access. By understanding the different methods and following best practices, you can enhance your digital security and keep your information safe.

Stay vigilant, stay secure, and make the most of 2FA to protect your digital identity.

—–

Please read our site disclaimer.